Daily Videos Blogs
Saturday, 3 June 2017
Top 10 Metal Songs with Riffs You Could Dance To
Friday, 2 June 2017
One Step Forward, Two Steps Back
This post One Step Forward, Two Steps Back appeared first on Daily Reckoning.
The nation appears trapped in a one-step-forward, two-steps-back economy… an economy of false starts… and false dawns.
We were told last month the economy added 211,000 jobs in April, crushing all expectations.
Unemployment fell to its lowest level since May 2007.
One step forward.
But May’s unemployment numbers came out today.
Economists expected 185,000 new additions to the national payrolls. The lowest estimate was 140,000.
The actual number?
Just 138,000 new jobs… undershooting the lowest projection.
In all, the American economy shed 367,000 full-time jobs last month… while adding 133,000 part-time positions.
“Clearly, we’re seeing some slowdown in job growth,” says Stuart Hoffman, senior economic adviser at PNC Financial Services.
The noble souls of the Bureau of Labor Statistics further report that hourly wages grew at the slowest rate since last March.
Two steps back.
Which naturally meant the stock market took one step forward today…
The Dow ended trading today 64 points to the good. The S&P was up seven. And the Nasdaq bulldozed its way to a 46-point gain.
That’s the way things work now, isn’t it?
But do the lackluster job numbers mean the Federal Reserve delays its expected rate hike on June 14?
Not according to Jim Rickards:
The report won’t matter… The Fed will raise interest rates 0.25% at that meeting. It would have taken a truly spectacular collapse in job creation, possibly as low as 50,000 jobs, to throw the Fed off course.
Michael Feroli, chief U.S. economist at JPMorgan Chase, agrees with Jim:
“This keeps the Fed on track.”
Just so.
Meanwhile, every time we’re told the economy’s taking a step forward, we’re later told it was a false step.
Earlier this year, for example, the Atlanta Fed projected first-quarter growth would take a lumbering 3.4% stride.
In reality, first-quarter GDP came in practically motionless at 0.7%.
If not quite a step back… a baby step forward.
We further discovered some sour news about the U.S. economy today…
Analyst Michael Snyder of The Economic Collapse blog tallied some numbers.
He reports that U.S. GDP grew an average of 1.33% from 1930–1939.
He then crunched GDP between 2007 and 2016.
The result?
U.S. GDP grew an average of 1.33% — the same precise number.
We’re loathe to exaggerate, or exaggerate much… but it appears economic growth is no better than it was in the 1930s.
History has a term for the 1930s — the Great Depression.
True, the 1930s witnessed greater swings — 1932 GDP was negative 12.9%, while 1936 GDP was positive 12.9%.
By way of comparison, 2009 turned in the lowest GDP number in the 2007–2016 period — negative 2.8%.
2015 saw the highest number — positive 2.6%
But both decades averaged 1.33% growth.
Snyder reminds us that Barack Obama was the only president in history who couldn’t swing a single year of at least 3% growth.
In terms of American history… two steps back.
Perhaps the economy will take that step forward under Donald Trump.
But until those tax cuts, deregulation and the rest of the “Trump stimulus” come to light, the nation could spend the next few years standing in place…
About where it’s been for the past 10 years…
Regards,
Brian Maher
Managing editor, The Daily Reckoning
The post One Step Forward, Two Steps Back appeared first on Daily Reckoning.
Thursday, 1 June 2017
The Surprising History of Market Shocks
This post The Surprising History of Market Shocks appeared first on Daily Reckoning.
The Federal Reserve has unleashed Pavlov’s dogs upon Wall Street…
Investors buy in the expectation that the Federal Reserve will sally to the rescue whenever stocks take fright.
The buying spree lifts the market — even if the Fed had no intention of intervening.
The point is years of conditioning have trained investors to expect intervention.
And through their salivating stock purchases… they conduct their own intervention.
The Fed has conditioned them well.
Markets never transacted business in this fashion until the Fed enthroned itself savior after 2008.
Bad news was in fact bad news. And markets took the news at face value — badly.
That is the viewpoint in current circulation: Pre-2008 markets were acutely sensitive to quakes.
Because of the Fed, today’s are not.
But is it necessarily true?
We introduced you to James Altucher yesterday. James once ran a fascinating study…
He ransacked history from the beginning of WWII to the seismic events of Sept. 11, 2001.
His purpose: to study the impact of potentially systemic shocks on markets.
James identified 10 potential haymakers that could have flattened markets for the count.
The most conspicuous among them:
The beginning of WWII (Sept. 1, 1939)…
Pearl Harbor (ask someone if you must)…
The Cuban missile crisis (Oct. 22, 1962)…
Sept. 11 itself.
James recorded the S&P’s antics the day before the shock… the day after… and its panicked low the week following the event.
He then examined the S&P one week later, one month later and six months later.
His conclusion?
“Each time, the market has absorbed the shock and moved past the event.”
When the Germans invaded Poland to lift the curtain on WWII — not the average day, and by a long chalk at that — the market acted like it was just another day.
The S&P slipped a bit, and found a shallow bottom just days after.
It then settled on higher footings for the next six months, according to James… as if Herr Hitler’s soldaten were mere tourists taking the pleasant sights of Europe.
Why weren’t markets in headlong retreat along with Western Europe? Didn’t they know?
The Fed wasn’t in the business of propping stocks in those days. So the answer must lie elsewhere.
It’s true that market reaction to Pearl Harbor was more pronounced.
The S&P went lower into January ’42. But it rediscovered its fighting elan shortly thereafter.
And the S&P opened every year higher than the last until 1946.
Of course, comes the objection: Stocks naturally rose on the prospects of ultimate victory.
Yes, but the S&P had stabilized in January ‘42 as U.S forces were getting licked by the Japanese.
American fortunes only changed after the Battle of Midway in June ’42… after the S&P had already turned.

What of the Cuban missile crisis?
The world was never closer to the brink. But after a brief stagger, the S&P went trotting ahead, merry as a grig.
“What is most interesting is the ferocity with which the market rallied in only a few months,” said James.
Apparently, the specter of nuclear oblivion — a sword of Damocles hovering over markets for the next 30 years — was never the bugaboo many feared.
James:
The party started in 1962 and continued for the next seven years, resulting in the biggest bull market in history until the 1990s.
Ah, yes, but Sept. 11, 2001…
The date itself makes an icicle of our spine.
Markets were closed one full week after the horrors. And traded down heavily upon opening.
But one month later, the S&P was just 15 points off its Sept. 10 closing.
And just six months afterward, the S&P was 73 points higher than its Sept. 10 closing.
Many suspected the silent hand of the Plunge Protection Team when stocks miraculously recovered once the market reopened.
But it doesn’t explain the next six months — a period during which Enron collapsed, incidentally.
James’ study ended before 2008, so the financial crisis didn’t come under his bifocals.
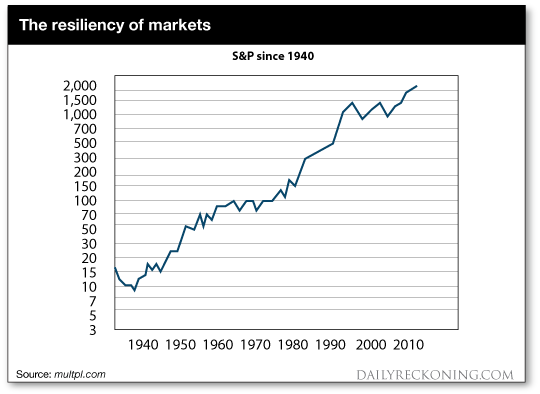
We know of course the S&P has trended in an upward channel since 2010 — more or less.
It’s likely the Fed’s cosmic money printing since the 2008 financial crisis likely negates any comparison to pre-crisis events.
It is indeed a new world… brave or not.
But the long sweep of history indicates markets bend in a resilient arc.
And the shocks prove less shocking than feared, if James is right:
The nation has nevertheless undergone shocks to the system that we have survived, and will continue to survive.
We can’t challenge the first point. We’re consoled by the second.
But nature has not gifted us with an optimistic spirit.
And given the size of the current bubble, we can’t put away the suspicion that the system might not survive the next shock.
Of course, we said the same thing in 2008. And 2001. And…
Regards,
Brian Maher
Managing editor, The Daily Reckoning
The post The Surprising History of Market Shocks appeared first on Daily Reckoning.
Huge Gains From Little Grains — A New Opportunity In U.S. Oil
This post Huge Gains From Little Grains — A New Opportunity In U.S. Oil appeared first on Daily Reckoning.
U.S. oil production is surging again.
The oil price collapse stopped the momentum for a while, but not for long. Incredibly this time, the growth is taking place with just $50 per barrel oil.
The driver of this growth is shale oil, and more specifically, shale oil from the Permian Basin in Texas. The Permian is the 800 pound gorilla that keeps OPEC awake at night.
This is not a short-term phenomenon. Shale oil will be changing the balance of power in the global oil market for decades to come.
I’m very bullish about rising shale oil production. But that does not necessarily mean I’m bullish on oil prices.
You can understand why since rising production and rising prices don’t really go together. Declining production would be better for oil prices.
There are however, other ways to profit from surging Permian shale oil production…
Sand, Sand, And More Sand – The Tiny Grains Behind The Shale BoomTo understand the Shale industry, you need to understand the process.
Before I get to the stunning trend I’ve been seeing, let me explain why sand is important for shale oil production.
The process of fracking involves using horizontal wells — wells that are turned horizontally at depth. Think of a well in an “L” shape where the base of the “L” is very long.
After a horizontal oil well is drilled, the producers pump water down the well at incredibly high pressures. That high pressure water fractures or “fracks” the oil bearing shale rocks that are in contact with the horizontal section of the well.
Once the rocks are fractured, water rushes into those fractures (cracks really), inflates them, and deepens the cracks in the rock. Sand that is pumped in with the water is carried into these cracks and “props” those fractures open to let oil (or gas) flow out.
In the image below, the yellow circles represent sand particles.

Source: Drilling Info
Without the sand to “prop” the fractures open, the fractures would close once the water pressure subsides which would reduce the amount of oil or gas that can escape.
Therefore, this frac sand is a crucial part of the shale oil production process, and is getting more important every day.
What the industry has found through constant trial and error, is that more proppant (more frac sand) means better shale oil wells.
Check the chart below which shows how much sand the industry has been using per horizontal well over time. The increase never ends, in fact it is still accelerating.

The chart shows the amount of frac sand being used per well in each major shale oil region. I want to focus in on the Permian since that is where the majority of shale oil drilling is now taking place.
Here is the amount of frac sand being used per well in the Permian in the fourth quarter of each year:
Q4 2013 – 1,000 tons
Q4 2014 – 1,800 tons (an 80% increase from Q4 2013)
Q4 2015 – 2,300 tons (a 28% increase from Q4 2014)
Q4 2016 – 5,000 tons (a 117% increase from Q4 2015)
The increase from Q4 2013 is incredible. From 1,000 tons of sand per well the industry is now using 5,000 tons.
What has really shocked me is the increase in just the last couple of quarters. The industry went from 4,000 tons in Q3 2016 to 5,000 tons in Q4 2016, a 1,000 ton increase in just the last quarter alone!
It is very clear that more sand equals more profitable wells.
Demand for this stuff is still skyrocketing after years of trial and error. I can’t wait to see how much sand will be used per horizontal well by the end of 2017…
Frac Sand Miners The Logical Choice – But Be CarefulEarlier this year, I kicked the tires on most of the publicly traded companies that supply frac sand to the oil and gas industry.
What I found were some incredibly expensive stocks, as well as some heavily leveraged ones.
Meaning there was an awful lot of growth baked into prices back then.

Source: northernminer.com
Since then, share prices have come back to much more reasonable levels and I think that the sector is worth another very close look.
My current favorite is U.S. Silica Holdings (NYSE:SLCA) for one major reason. The company has zero net debt on its balance sheet. As we are reminded on a regular basis, the commodity business is a painfully cyclical one — and in my opinion, not well suited for a lot of leverage.
And commodity companies like this with pristine balance sheets don’t just survive unexpected bumps in the road, they take advantage of them by picking of weaker competitors. Which is exactly what we saw U.S. Silica do in 2016.
If you’re looking to add a quality frac sand company to your portfolio, U.S. Silica is where to look first.
Here’s to looking through the windshield,

Jody Chudley,
Chief Credit Analyst, The Daily Edge
EdgeFeedback@AgoraFinancial.com
The post Huge Gains From Little Grains — A New Opportunity In U.S. Oil appeared first on Daily Reckoning.
Wednesday, 31 May 2017
Top 10 Gamma Ray Songs of the 90s
The Facebook Algorithm Demystified: How to Optimize for News Feed Exposure

Are your posts reaching fewer people on Facebook? Wondering how to appear in more people’s news feeds? Facebook’s algorithm dictates who sees your content and who doesn’t. In this article, you’ll discover how the Facebook algorithm works, and how marketers can optimize their posts for maximum news feed visibility. #1: How Facebook’s News Feed Algorithm Ranks [...]
This post The Facebook Algorithm Demystified: How to Optimize for News Feed Exposure first appeared on .
- Your Guide to the Social Media Jungle